
The direct answer
A thesis results chapter reports what you found, in order, with tables and figures that speak for themselves. One section per research question, tables and figures first, then short text that points at them. No argument, no interpretation, no comparison with earlier work — that is the discussion chapter’s job. Report every result, including the unexpected ones, and leave the raw data in an appendix.
You have the data in front of you: spreadsheets, transcripts, counts, quotes. Now you have to turn it into a chapter, and the hardest part is restraint. Every result feels like it needs explaining. Every unexpected number feels like it needs defending. Resist both. The results chapter has one job: show the reader what happened. The moment you start explaining why it happened, you have left the chapter.
Your examiner reads the results to check the discussion later. If the results are complete and the numbers match the tables, the discussion stands on solid ground. If results are missing, numbers change between the table and the text, or interpretation is smuggled in, the examiner stops trusting the chapter — and the discussion built on it.
The system in short
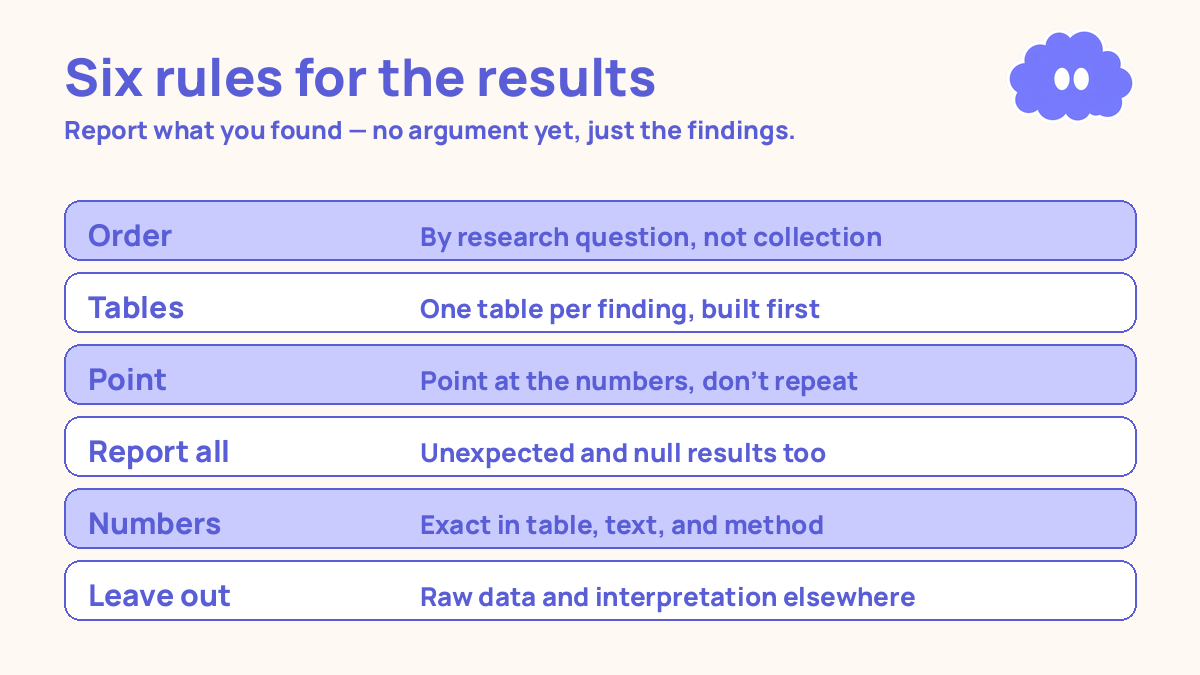
- Order the results by research question, not by the order you collected the data.
- Build the tables and figures first, one per finding, with clear titles and captions.
- Write short text under each table or figure: what it shows, in one or two sentences, pointing at the numbers.
- Report every result, including the ones that contradict your question.
- Keep the numbers exact and identical in the table and the text.
- Leave out the raw data, the interpretation, and the literature — they belong elsewhere.
Results on their own are not an argument — How to write a thesis discussion chapter turns them into one.
Step 1: Order by question, not by collection
Start with your research question, and split the results into one section per sub-question. If your question has three parts, the chapter has three sections, in the same order as the question. The reader follows the question through the chapter and can see, section by section, whether each part was answered.
Do not order the results by the order you collected the data. The order of collection is an accident of your timetable. The order of the question is the order of the argument. A chapter that follows the timetable reads like a diary.
If a result does not fit any sub-question, ask whether it belongs in the thesis at all. Interesting results that answer nothing the thesis asked are the hardest to cut, and the most important to cut.
Step 2: Build the tables and figures first
Before you write a word, build the tables and figures. One table per finding. One figure per pattern. Give each one a number, a title that says what it shows, and a caption that says what the reader should notice.
A good table is readable on its own. The reader should understand it without reading the text around it. That means clear column headings, exact numbers, and no unexplained abbreviations. If a table needs a paragraph of explanation to be understood, the table is badly built.
Figures are for patterns, not for decoration. A bar chart that shows replies rising after 6pm earns its place. A chart that repeats a table the reader has already seen does not. If the figure and the table say the same thing, keep one and cut the other.
Step 3: Write text that points, not repeats
Under each table or figure, write one or two sentences. Say what the table shows, and point at the numbers. “Replies were slowest after 6pm: the three clinics answered 41 of 214 messages within an hour, and 96 after more than four hours” points at the table. “As Table 2 shows, the results were interesting” points at nothing.
Do not repeat the table in sentences. If the table says 41 of 214, the text does not need to say it again in different words. The text should tell the reader what to notice — the highest number, the gap between two groups, the pattern across the rows.
Keep the text short. A results section of three sentences under a clear table is better than a page of prose around a confusing one. If you find yourself writing long paragraphs in the results chapter, the table is probably doing too little. Fix the table.
Step 4: Report every result, including the unexpected ones
Report the results that contradict your question, the results that show nothing, and the results that are messy. An unexpected result is still a result, and a null result — no difference found — is still a finding. Hiding them is the one thing that will damage your thesis, because an examiner who finds a missing result later will not trust the rest.
Write the unexpected result in the same plain way as the rest. One sentence, with the numbers. “The clinic with the automated replies answered no faster than the two without them: 38 of 71 messages within an hour, against 41 of 72.” No apology, no excuse, no explanation. The explanation belongs in the discussion.
Step 5: Keep the numbers exact and identical
Numbers are the results chapter’s currency. Every count, every average, every percentage must be exact, and must be the same wherever it appears. If the table says 214 messages, the text must say 214 messages, and the methodology must say 214 messages. Test yourself on the key numbers: close the spreadsheet, write them from memory, then check. Dunlosky and colleagues rated practice testing as one of only two high-utility learning techniques in their 2013 review.
Round consistently. If you report one average to one decimal place, report them all to one decimal place. If a percentage comes from 41 of 214, write the count as well as the percentage, so the reader can check the arithmetic. A percentage on its own, with no count behind it, is a number the reader cannot verify.
Step 6: Leave out the raw data, the interpretation, and the literature
Three things do not belong in the results chapter. The raw data goes in an appendix. The interpretation goes in the discussion. The literature — what earlier studies found — goes in the literature review and the discussion, not here.
Raw data in the results chapter buries the findings. A reader who has to wade through 200 messages to find the pattern will stop reading. Summarise: counts, averages, themes, with the raw material in an appendix for anyone who wants to check.
Interpretation confuses the reader about what is a finding and what is your view of it. “Replies were slow after 6pm” is a finding. “Replies were slow after 6pm because staff had gone home” is an interpretation, and it belongs in the discussion.
A worked example: one week, a first draft
You have a week and a blank results chapter. Your study collected 214 patient messages across three clinics. Your target is a first draft of about 1,200 words plus four tables — the chapter is mostly tables, and tables are built, not written.
| Day | Block | Job | Words |
|---|---|---|---|
| Monday | 50 minutes | List the findings, one per sub-question, and sketch the tables | 0 new, outline only |
| Tuesday | 2 × 50 minutes | Build the tables and figures, titles and captions | 200 |
| Wednesday | 2 × 50 minutes | Draft the text under each table, pointing at the numbers | 400 |
| Thursday | 2 × 50 minutes | Draft the unexpected results and the null results | 400 |
| Friday | 1 × 50 minutes | Check every number: table against text, text against data | 200 fixed |
Monday is an outline day. Write the sub-questions, then list under each one the findings that answer it. If a finding answers no sub-question, move it to the appendix list. Then sketch each table on paper: rows, columns, and the numbers that will fill them.
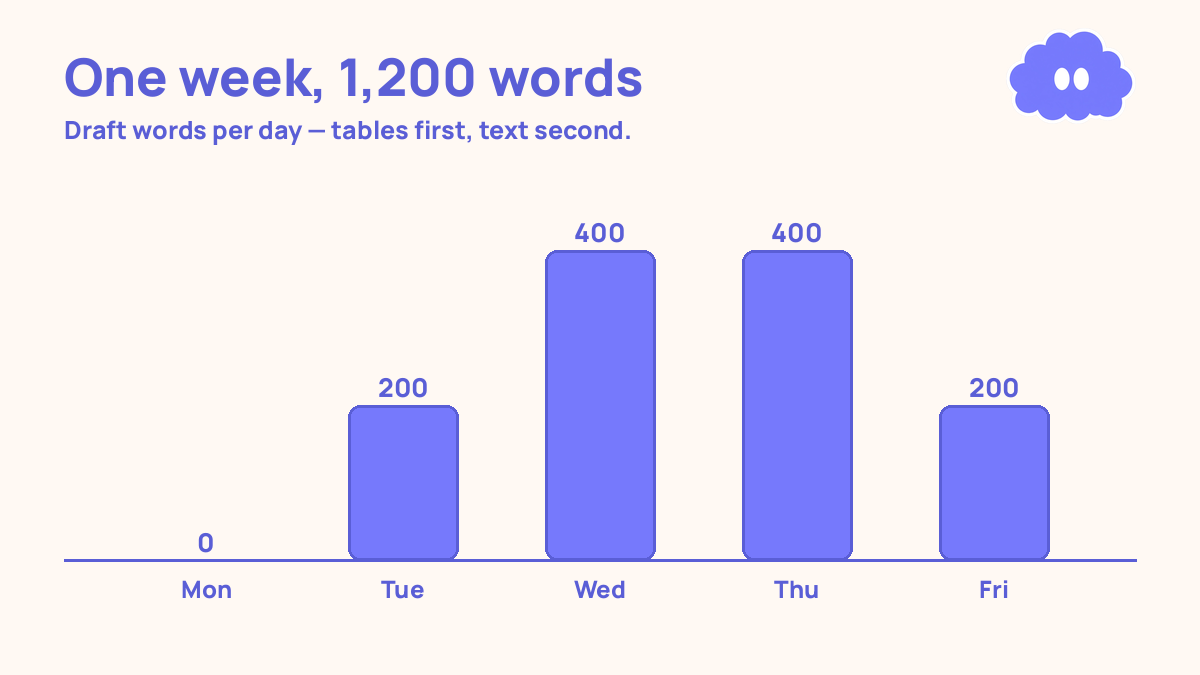
Tuesday is a building day. Build the tables and figures before writing any text. Give each one a number, a title, and a caption. Then read each table on its own, as if you had never seen the data. If you cannot understand it, fix the table now, while it is cheap.
Wednesday and Thursday are writing days. Two 50-minute blocks each, with a real break between them. Write short text under each table: what it shows, pointing at the numbers. Thursday is for the hard results — the unexpected ones, the null ones. Write them in the same plain way as the rest.
Friday is a checking day. Check every number three ways: table against text, text against data, data against the methodology chapter. Then leave the chapter alone for a day if you can. Cepeda and colleagues found in 2006 that spaced practice beat massed practice, and the gap grows with how long you need to remember the material. A number checked after a gap is a number you actually see.
When it goes wrong
Your results chapter is a diary. It follows the order you collected the data, not the order of the question. Reorder the sections by sub-question. If a result fits no sub-question, move it to the appendix.
Your text repeats your tables. Every number in the table appears again in the paragraph, in different words. Cut the repetition. The text should say what to notice in the table — the highest number, the gap between two groups — not restate it.
A number changes between the table and the text. The table says 214, the text says 212. Check every number three ways: table against text, text against data, data against the methodology. A number that changes is the easiest error for an examiner to find.
You hid an unexpected result. The clinic with automated replies was no faster, and you left it out. Put it back, in one plain sentence with the numbers. An unexpected result reported honestly is a finding. An unexpected result hidden is a reason not to trust the chapter.
Weekly review checklist
Copy this list and use it each week while you write the results:
- Is every section tied to one sub-question, in the question’s order?
- Can each table be understood on its own, without the text around it?
- Does the text point at the numbers instead of repeating them?
- Are the unexpected and null results reported, in plain sentences?
- Is every number identical in the table, the text, and the methodology?
Downloadable infographic spec: one vertical image, title “The results chapter in six rules”, with the six rules — order by question, tables first, point don’t repeat, report everything, numbers exact, leave out the rest — in Thynq cream, Cloud Purple, Dark Purple and pink, with the cloud mascot. Text taken word-for-word from this article.
What this system is not
It is not a way to make weak results look strong, and it is not a promise that a tidy results chapter guarantees a good grade. It is a way to report what you found so plainly that a reader can check it. A clear results chapter gives the discussion something solid to stand on. It cannot make findings appear that are not in the data.
Sources
- Dunlosky, J., et al. (2013). Psychological Science in the Public Interest, 14 (1), 4-58. Only practice testing and distributed practice received a high utility rating.
- Cepeda, N. J., et al. (2006). Psychological Bulletin, 132(3), 354-380. Spaced practice beat massed practice, and the optimal gap grows with how long you need to remember the material.
For the whole thesis, start with the thesis writing system that keeps moving. For how the method behind these results should be described, see how to write a thesis methodology.
Questions
Do I interpret my results in the results chapter?
No. Report what you found, in order, with tables and figures. Save the meaning for the discussion chapter. A sentence that says what a result means belongs in the discussion, not here.
What if a result is unexpected or contradicts my question?
Report it anyway, in the same plain way as the rest. An unexpected result is still a result. Hiding it is the one thing that will damage your thesis, because an examiner who finds it later will not trust the rest.
How many tables and figures should a results chapter have?
As many as your findings need, and no more. One table per finding, one figure per pattern. A table that repeats what the text already says is a table to cut. A finding with no table or figure is a finding the reader has to take on trust.
Where does the raw data go?
In an appendix, not in the results chapter. The chapter shows the summarised findings — counts, averages, themes. The raw data is there for a reader who wants to check, not for a reader who wants to follow the argument.